Next Week's Risk Dashboard
- Why US trade policy uncertainty has increased…
- …and what could happen from this point forward
- Bank of Canada to hold & why
- ECB to deliver another guarded rate cut
- RBI to increase policy accommodation
- Russian central bank still grappling with high inflation
- Canadian jobs—three in a row, and why it doesn’t matter
- Another resilient nonfarm payrolls report
- OPEC+ to hike production
- Other global macro: China PMIs, Eurozone CPI, US ISMs
Chart of the Week

The best thing to do about a broken window is to repair it, then break it again. That’s the logic to the US administration’s response to having suffered a setback on its protectionist agenda.
A key risk into the Monday market open and beyond is centered upon the Trump administration’s efforts to plot a potentially new course for tariffs and trade negotiations after the setbacks against its agenda this past week. Peter Navarro-unelected trade advisor to Trump—has indicated that the US Trade Representative, Jamieson Greer, will offer broader trade policy options and possible next steps into the weekend.
The rest of the week will be jam-packed with developments including policy decisions by the Bank of Canada, ECB, RBI and Central Bank of Russia, plus Canadian and US jobs reports, the weekend OPEC+ decision that may raise July’s output level by over 400kbpd, and other macro readings.
US TRADE POLICY UNCERTAINTY HAS INCREASED
As for US trade policy, the issues were outlined in a morning note this past Thursday (here). Recall that the U.S. Court of International Trade—a federal court—ruled that Trump’s use of International Emergency Economic Power Act provisions to impose tariffs under fabricated emergency conditions while bypassing Congress exceeded his legal authority and ordered them to be “vacated,” meaning there is an injunction against using the Act to impose tariffs again. The ruling temporarily struck down ‘Liberation Day’ tariffs and Trump’s ‘fentanyl’ tariffs against Canada, Mexico and China. That is, until the Federal Circuit Court of Appeals stayed the decision as it considers an appeal by the administration—thereby leaving the tariffs in place for now.
Uncertainty has risen once again. At stake are whether the appeal succeeds, or whether the appeals court reinforces the Trade Court’s decision. If the appeal succeeds, then we’re still on the same uncertain timelines toward the threatened July 9th deadline for steeper tariffs against Europe and the expiration of the 90-day deal with China by mid-August. Along that path will be uncertain progress toward striking agreements. To that effect, Treasury Secretary Bessent has noted that US-China talks have stalled and the US has accused China of cheating on its agreement; not good by my reading.
If the appeal fails then it is likely to go to the Supreme Court. If that fails and the IEEPA tariffs are struck down for good, then as chart 1 demonstrates, there remain multiple other tariff tools for the administration to consider and it may not be possible to legally challenge their use. There are multiple other trade lawsuits against the US administration (here, select ‘trade law’), but key may be whether these other tools could be challenged by the courts.
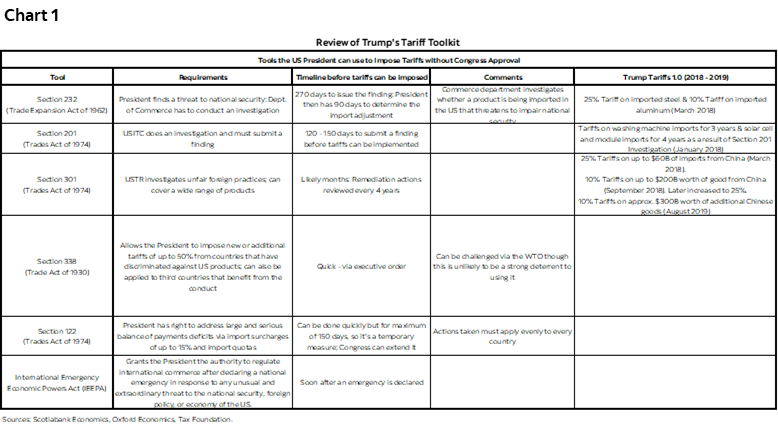
Navarro has noted that Section 122 tariffs could be used as a substitute albeit one at a lower 15% tariff cap with import quotas that must apply against everyone and only for 150 days. This provision only requires the allegation of ‘large and serious balance of payments deficits’ without proving their cause. Most economists would argue that the Trump administration ignores domestic policy drivers of large US current account deficits and capital account surpluses.
Section 232 tariffs are another option and require a lengthy investigation. Recall this is the provision used by Trump to apply tariffs on autos, steel and aluminum and so it’s possible it is used to backfill any cancelled IEEPA tariffs. Don’t count on court challenges to this one. Recall that on March 27th 2023, the Supreme Court refused to hear a petition against using this provision to impose steel tariffs. They had also denied a similar petition a year prior. This refusal to hear the petition followed a lower court ruling that upheld the right to apply these tariffs by saying they were not reviewable under federal law.
Navarro also indicated that Section 301 tariffs could be ramped up. They have been used by the Trump administration in other cases and could also be substituted for IEEPA tariffs. (HMTX Industries LLC v United States) addresses the use of Section 301 tariffs against China during Trump’s first term. HMTX lost the initial case in the Court of International Trade but appealed. The US Court of Appeals for the Federal Circuit heard arguments in January of this year and its decision on using Section 301 tariffs against China is pending. Then that may be appealed and could also ultimately go to the Supreme Court. By my understanding, it’s thought there are low odds of success.
Additional tools that could be employed include Section 201 tariffs that require lengthy investigations but that may draw upon prior inquiries, and Section 338 tariffs. The latter appears to offer broad flexibility to determine when other countries have discriminated against US products and allows tariffs of up to 50% to be applied by executive order.
BANK OF CANADA—THEY’VE NEVER CUT LIKE THIS
The Bank of Canada delivers its latest policy statement and rate decision on Wednesday at 9:45amET along with the publication of the Governor’s opening remarks to his press conference that itself follows forty-five minutes later. There will be no MPR with this one so the next forecast update will come with the July 30th decision that occurs on the same day as the FOMC.
Deputy Governor Kozicki will deliver a roundtable chat on communications the next day. A first playful question could be when do you expect to return to communicating an actual forecast?!
The policy rate is expected to be kept unchanged at 2.75% which has long been our view throughout all of 2025. Markets now only have a one-in-five chance of a cut priced after backing away from what had been pricing for more than a quarter point cut around early April. All other major Canadian banks’ economics shops had a cut for this meeting until recently but are now more divided while using GDP figures as an excuse to re-write their expectations.
Here is a summary of the influencing factors behind the call. They build upon many prior notes including recent ones such as this one and this one.
Inflation is Still too High
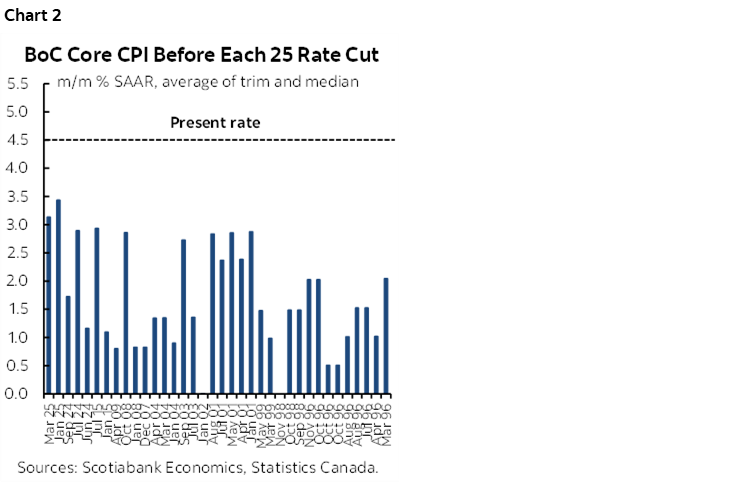
Ever since it adopted the current benchmark policy rate in 1996, the Bank of Canada has never cut when core inflation in the immediately preceding and freshest report was as high as it is this time. At 4½% m/m at a seasonally adjusted and annualized rate, the average of the trimmed mean and weighted median measures of inflation in April was off the charts compared to every time the BoC has cut in the past three decades (chart 2). The BoC has only twice cut when this measure was over 3%. Twenty-two out of thirty-six times when they’ve cut inflation has been under 2% including nine when it was at 1% or less.
And it’s not just the latest report. It would be a mistake for the Bank of Canada to ignore the evidence before them. Chart 3 shows this measure has been elevated for an extended period of time. Arguments for why inflation remains sticky were offered in last week’s weekly here.

Absent extremely good arguments, it would be disconcerting if an inflation-targeting central bank already at—or possibly below—neutral were to see fit to add more to monetary policy stimulus without a shred of evidence that they’ve been able to bring this measure within the target zone.
Policy is Already Neutral/Easy
Unless Macklem thinks he’s going to be plumbing the lower bound again he has only a limited number of bullets left in the chamber. The policy rate of 2.75% is in the neutral zone and possibly either slightly restrictive or slightly easy. It’s not like the Federal Reserve that is still strongly restrictive.
Wonky Jobs Data
Should the BoC cut because of what appears to be a weak job market? Canada has only added just over 50k jobs ytd in 2025 including one bad report for March (-33k) and even April’s tally that recorded about a 30k drop excluding temporary election-related hiring. The next jobs report two days after the BoC decision is likely to post another loss as argued in the section of this report that previews the Canadian jobs release.
The concern I have lies in the extent to which these numbers rely upon faith in Statcan’s extreme seasonal adjustments for every month this year so far. This is explained more fully in the jobs report preview in this weekly. Those SA factors will soon pivot toward overstating job growth. The BoC would be silly to overreact to a few jobs readings this year in the face of such concerns over data quality as opposed to evaluating a fuller set of readings over coming months.
Too Soon to Have More Confidence
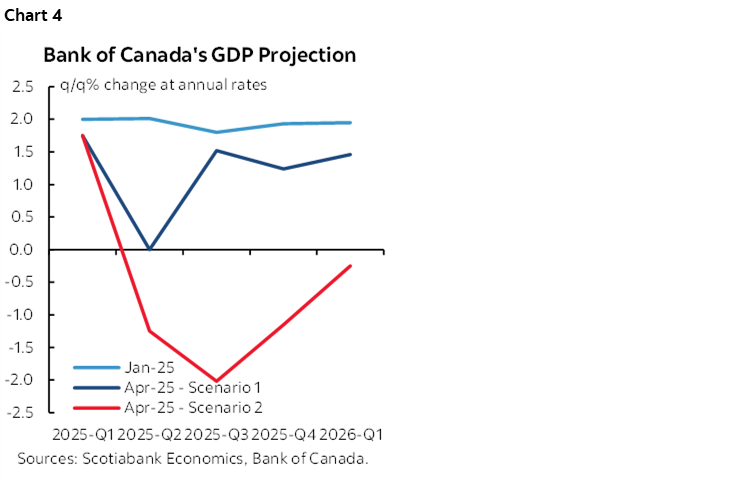
The Bank of Canada had so little confidence in the outlook at its last decision on April 16th that it boycotted the forecasting game. Instead, they embraced two scenarios and said they didn’t know which one to pick (chart 4). Can they really say that six weeks later they suddenly have confidence to forecast especially when they don’t have to face the decision of whether to resume publication of a base case projection until late July?
Governor Macklem remarked on May 22nd at the conclusion of the G7 Finance Ministers and Central Bankers meeting in Banff, Alberta that uncertainty has come down somewhat and that the more uncertainty comes down, the more forward looking they can be. That could be construed as a sign they are leaning further toward confidence to assemble a base case projection and in appropriate next steps. Any such confidence bounce, however, may have been dented by the fact we’re entering a fresh set of unknowns by way of how the Trump administration could handle its response to a federal court’s ruling against the use of IEEPA tariffs.
The BoC’s next forecasts are due on July 30th and that may be a more suitable moment for re-evaluating uncertainty. It would also take us past whatever may happen around the July 9th expiration of the delayed US tariffs on the EU and closer to the expiration of the 90-day suspension of more punitive tariffs on China by mid-August.
For now, GDP is tracking a little firmer than the BoC had anticipated and puts them in no rush to have to react.
Supply Side Challenges
Yes, the demand side is softening as evidenced by readings from housing markets and soft data like confidence gauges to name a few. But the supply side is also getting hit through probably diminished appetite to invest and what over time is emerging to be more restrictive immigration policy all the while productivity challenges remain. The BoC’s job is to align supply with demand, not to just focus upon the demand side. The mistake made by many coming out of the pandemic was to craft policy rate forecasts by downplaying if not ignoring supply side developments and the potential effects on inflation.
Inflation Expectations Remain Too High
Various measures of inflation expectations remain elevated (charts 5–7).

Fiscal Stimulus
Fiscal stimulus is coming and the BoC may be leery toward combining additional monetary stimulus given the recent history of overdoing it on both counts. A modest amount is being delivered in the near-term given provincial government stimulus and federal government actions (here). A 1% reduction in the lowest income tax bracket is scheduled for Canada Day that is estimated to save up to $840/year. The GST on new home sales up to $1 million by first time buyers has already been eliminated and the GST on new home sales valued between $1–1.5 million has been reduced in linear fashion starting from no tax on $1 million to the full GST on homes valued at $1.5 million and up. The consumer portion of the carbon tax was eliminated at the start of April. Further tax relief for housing is expected. Bigger amounts of stimulus are forthcoming in a Fall federal budget and are expected to be substantial at 1%+ of GDP.
Labour Markets Are Still Supporting Inflation Risk
Jobs, the unemployment rate, wages and productivity are all subject to varying lags in reaction to developments. However, one million workers face expiring collective bargaining agreements in Canada (chart 8) when it’s already the case that wage settlements continue to be high (chart 9). About 30% of Canadian workers are unionized—triple the US rate—and so the lagging effects of labour market developments may take years to unfold and against the backdrop of further upward wage resets from agreements set in the pandemic that are now expiring. These higher wage settlements are not supported by productivity (chart 10) and therefore at least present a floor to inflation risk.

Tariffs to Pass Through to Inflation
There will be modest pass through via three channels. One is limited retaliation. More important may be pass through from crazy US import tariffs via their supply chains into Canada's. Three is the impact on supply chains and product availability that in some categories may be drying up as we speak. Until you know more about pass through via complex channels a central bank mandated to target low and stable inflation shouldn’t be doing anything.
There is No Pressure to Act from Markets
Markets have only 5bps of a cut priced for this decision. They couldn’t care less if the BoC whiffs. They are putting no pressure whatsoever on the BoC to cut. I’d be the first to say that the BoC should do the right thing without caring about markets, but at least we can say the BoC shouldn’t be worried about any market dislocation effects if it did nothing this time. For that matter, they can do it on the bias if they so choose, though I doubt they would be comfortable doing so.
But cutting now when it’s nowhere close to being priced and after holding since March could motivate markets to think that the BoC is priming for another round of easing. You can’t just take one chip out of the bag. Markets would probably price another cut for the July meeting and maybe add more later. You’d better have a lot of confidence that a cut now is the right thing to do given the risk that it could spark outsized easing of financial conditions compared to the policy rate adjustment itself.
ECB—ANOTHER GUARDED CUT
The European Central Bank is widely expected to cut its policy rate by 25bps at 8:15amET on Thursday, followed by a press conference with ECB President Christine Lagarde at 8:45amET. Markets have fully priced in this rate cut and anticipate another by the end of the year.
At its April meeting, the ECB noted that the disinflation process was well on track, with underlying inflation indicators suggesting a gradual stabilization around the 2% target on a sustained basis. Additionally, the bank removed the term "restrictive" from its statement, and President Lagarde highlighted increased downside risks to economic growth. Since then, April's inflation reading showed an uptick. However, Tuesday’s upcoming May report is expected to reflect a cooler inflation reading and ECB wage indicators also point to slowing wage growth (charts 11). Furthermore, while Q1 economic growth exceeded consensus expectations (0.3% q/q SA vs. 0.2%), ongoing trade disputes and rising tariff uncertainties stemming from the U.S. are likely to weigh on the economic outlook.

The ECB's updated forecast will be crucial in assessing the potential impact, especially given that this will be its first revision following the latest round of tariffs imposed by former U.S. President Donald Trump on Liberation Day. Given that the ECB is approaching a neutral setting, the bias may continue to be expressed in guarded, careful, data dependent fashion.
RBI—MORE ACCOMMODATING
The Reserve Bank of India is unanimously expected to further cut its repo rate by 25bps on Friday, marking the third consecutive reduction in 2025 for a total cumulative cut of 75 bps so far.
At its last meeting, after gaining greater confidence that inflation was aligning with the 4% target, the bank shifted its stance from 'neutral' to 'accommodative' to further support growth amid a moderate economic outlook.
Since then, headline inflation has continued to ease, driven by a correction in food prices, reinforcing the bank’s confidence in supporting growth while keeping inflation in check (chart 12). Key will be to watch whether the bank provides further guidance on additional policy support for the rest of the year.

RUSSIAN CENTRAL BANK— DELIVERING ON GUIDANCE
The Russian central bank is expected to maintain its one-week auction rate at 21% on Friday for the fifth consecutive time, as inflation and inflation expectations remain elevated. At its last meeting, the bank did not discuss monetary easing, and the governor stated, "We will maintain tight monetary policy conditions for a lengthy period" with the baseline forecast for the policy rate to be in the range of 19.5 – 21.5% in 2025.
CANADA’S JOB MARKET—THREE IN A ROW? AND WHY IT DOESN’T MATTER
Canada probably lost jobs for a third month in a row, but with a big caveat that I’ll come back to while explaining why I don’t believe the job market numbers we’re getting from Statcan. We’ll find out on Friday when the Labour Force Survey for May arrives at the same time as US nonfarm payrolls.
I’ve estimated a drop of about 25k jobs. A big driver will be the reversal of the extra 37k public administration jobs that were recorded the prior month because April’s reference week included two of the days of advance polling before the April 28th federal election. Chart 13 shows the evidence from past elections.

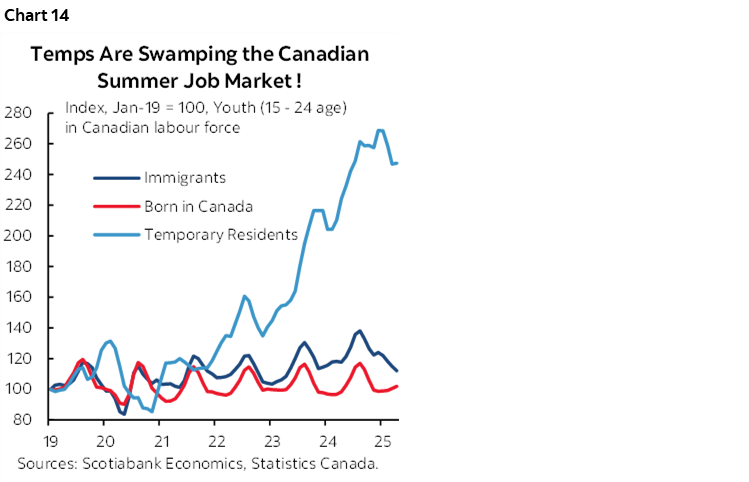
Youth employment could also be a significant drag. These folks are flagging that summer job postings this year are tracking lower than recent years but still above pre-pandemic levels. An added complication is that efforts to reduce the number of temporary residents in Canada have not yet borne fruit (chart 14). They are relatively more likely to fill jobs in seasonal occupations. In seasonally adjusted terms, employment for youths aged 15–24 has dropped by 9k last May and 68k the prior May as the temporary resident category mushroomed.
Third is the fact that seasonal adjustment factors tend to subtract from hiring at this time of year for reasons beyond just youth employment as the country emerges from its prolonged winter. Seasonally unadjusted job growth is usually substantial (chart 15) but seasonal adjustments in recent years have been doing more than usual to compensate given a recency bias in how they are calculated (chart 16).

Even the seasonally unadjusted figure might be on the weak side this time around. One reason is the weather. This has been a lousy Spring in many parts of Canada. It has been cooler and wetter than usual, with this May being the coldest month of May since 1967. That could have restrained or delayed seasonal hiring and not just for youths.
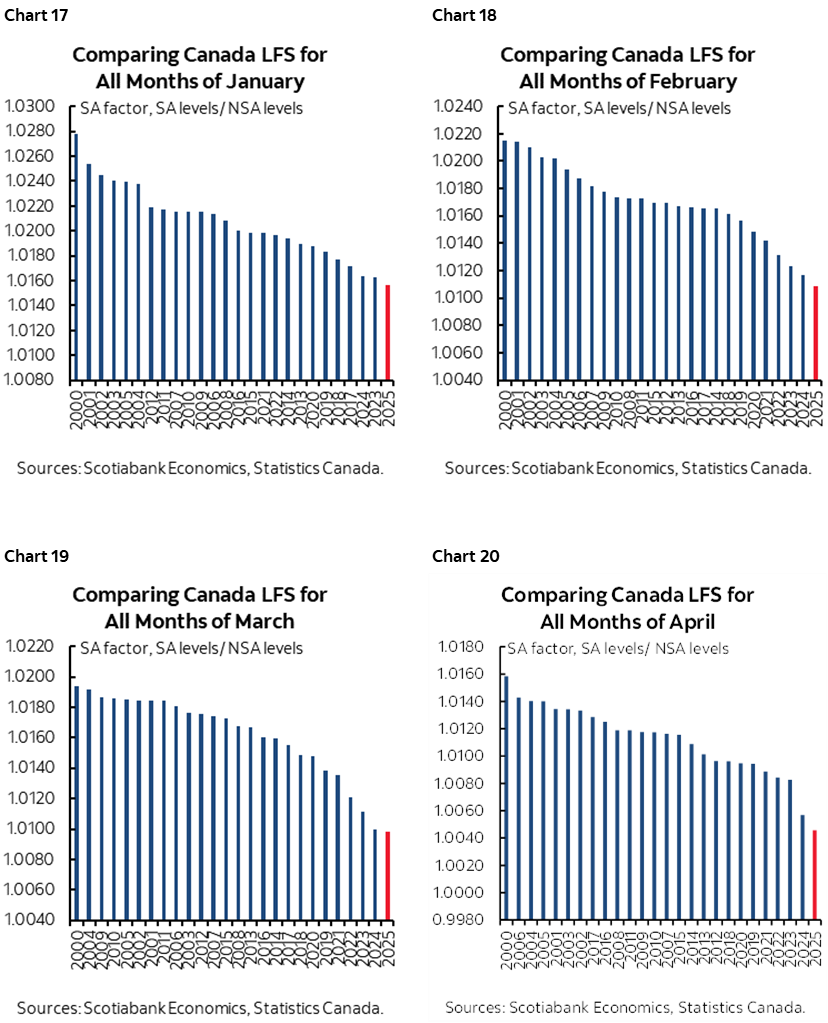
Now for the trust factor in Statcan’s employment figures. I don’t trust the seasonal adjustment factors Statcan has been employing and they’ve been a major reason for weakness in reported jobs. Each of the first four months of this year has employed the lowest seasonal adjustment factor on record compared to like months in history (charts 17–20). There is a strong recency bias to how they are calculated by way of emphasizing the narrow and distorted experience of the pandemic era which is why they’re all trending downward over recent years.
Using Statcan’s reported numbers, Canadian employment is up 52k over the first four months of 2025. If we instead applied historically average SA factors for each month this year, then year-to-date job growth would be about 185k, or roughly three-and-a-half times as much. Adjust accordingly to somewhere in the middle and split the difference. Go high on the SA factors and job growth would have blown out the lights so far this year.
There is likely to be one more month of this as May’s SA factor is likely to be low again, before the SA factors shift toward being among the highest on record compared to like months in history over June, July and August.
Canada also refreshes labour productivity figures for Q1 on Wednesday. They are expected to be weak.
NONFARM PAYROLLS—IT’S NOT JUST ABOUT HIRING APPETITE
Another monthly payrolls report arrives on Friday, this time for May. I’ve estimated a gain of 180k with the usual trepidation given the wide 90% confidence band of +/-136k around monthly job change estimates.
The reading is tentative ahead of a series of other labour market updates that will arrive before nonfarm. They include JOLTS job openings for April (Tuesday), ADP private payrolls for May (Wednesday), Challenger mass layoffs for May (Thursday), and ISM employment subindices on Monday (manufacturing) and Wednesday (Thursday). NFIB small business hiring measures don’t arrive until after payrolls. Still, consumers are indicating that jobs are becoming harder to come by (chart 21).

One reason for an elevated reading is that we’re still in an environment in which seasonal adjustment factors will overstate payrolls. The SA factors for recent months of May have been among the highest compared to like months of May in history (chart 22).

These SA factors applied against seasonal hiring patterns as the weather turns in significant parts of the country (chart 23) could combine to provide a meaningful lift to payrolls.

Given the longer-run correlations between GDP growth and employment growth in a variant of Okun’s ‘law’, the fact that Q2 nowcasts continue to point to solid growth may be supporting hiring appetite.
Since payrolls count jobs instead of job holders the climate of economic uncertainty may continue to motivate double counting of more positions as the number of multiple job holders trends higher (chart 24).

With each passing month it becomes more likely that federal civil servant layoffs will show up, but I would expect them to continue to be offset by state and local government hiring (chart 25).

A bigger risk is when the year-to-date pick-up in layoffs outside of government begins to show up more significantly in payrolls (chart 26). For this reason, I’ve capped the upside to payrolls.

Weather isn’t likely to be a factor with this report. The San Francisco Fed’s weather-adjusted payrolls for April only added about 23k to the officially reported estimate and therefore may have a minor hand-off effect on May payrolls. Ditto for the companion household survey of employment’s measure of unable to work due to weather in April. There isn’t likely to be a meaningful impact of weather in the May nonfarm reference period.
Strike effects are likely to be minor with only 7,000 workers on strike in May which was little changed compared to April.
GLOBAL MACRO ROUND-UP
Chart 27 highlights whatever hasn’t been considered to this point in this publication with brief, select highlights to follow.

In the US, the main releases other than nonfarm will be the pair of ISM reports covering the month of May. ISM-manufacturing is due on Monday and will probably remain in contraction, with ISM-services on Wednesday expected to continue to show mild growth. Vehicle sales during May are expected to pull back as tariff front-running effects ebb.
China will refresh the state’s PMIs for May shortly after this publication is distributed. Little growth is expected.
Eurozone CPI for May (Tuesday) should offer muted market effects with the readings from the main anchor economies already known. A soft tone is expected that is conducive to another rate cut on Thursday.
In Canada, there will be little else to consider beyond the dominance of the Bank of Canada and jobs report. Trade figures for April on Thursday will help us understand whether tariff front-running effects are ebbing and the consequences for Q2 growth.


DISCLAIMER
This report has been prepared by Scotiabank Economics as a resource for the clients of Scotiabank. Opinions, estimates and projections contained herein are our own as of the date hereof and are subject to change without notice. The information and opinions contained herein have been compiled or arrived at from sources believed reliable but no representation or warranty, express or implied, is made as to their accuracy or completeness. Neither Scotiabank nor any of its officers, directors, partners, employees or affiliates accepts any liability whatsoever for any direct or consequential loss arising from any use of this report or its contents.
These reports are provided to you for informational purposes only. This report is not, and is not constructed as, an offer to sell or solicitation of any offer to buy any financial instrument, nor shall this report be construed as an opinion as to whether you should enter into any swap or trading strategy involving a swap or any other transaction. The information contained in this report is not intended to be, and does not constitute, a recommendation of a swap or trading strategy involving a swap within the meaning of U.S. Commodity Futures Trading Commission Regulation 23.434 and Appendix A thereto. This material is not intended to be individually tailored to your needs or characteristics and should not be viewed as a “call to action” or suggestion that you enter into a swap or trading strategy involving a swap or any other transaction. Scotiabank may engage in transactions in a manner inconsistent with the views discussed this report and may have positions, or be in the process of acquiring or disposing of positions, referred to in this report.
Scotiabank, its affiliates and any of their respective officers, directors and employees may from time to time take positions in currencies, act as managers, co-managers or underwriters of a public offering or act as principals or agents, deal in, own or act as market makers or advisors, brokers or commercial and/or investment bankers in relation to securities or related derivatives. As a result of these actions, Scotiabank may receive remuneration. All Scotiabank products and services are subject to the terms of applicable agreements and local regulations. Officers, directors and employees of Scotiabank and its affiliates may serve as directors of corporations.
Any securities discussed in this report may not be suitable for all investors. Scotiabank recommends that investors independently evaluate any issuer and security discussed in this report, and consult with any advisors they deem necessary prior to making any investment.
This report and all information, opinions and conclusions contained in it are protected by copyright. This information may not be reproduced without the prior express written consent of Scotiabank.
™ Trademark of The Bank of Nova Scotia. Used under license, where applicable.
Scotiabank, together with “Global Banking and Markets”, is a marketing name for the global corporate and investment banking and capital markets businesses of The Bank of Nova Scotia and certain of its affiliates in the countries where they operate, including; Scotiabank Europe plc; Scotiabank (Ireland) Designated Activity Company; Scotiabank Inverlat S.A., Institución de Banca Múltiple, Grupo Financiero Scotiabank Inverlat, Scotia Inverlat Casa de Bolsa, S.A. de C.V., Grupo Financiero Scotiabank Inverlat, Scotia Inverlat Derivados S.A. de C.V. – all members of the Scotiabank group and authorized users of the Scotiabank mark. The Bank of Nova Scotia is incorporated in Canada with limited liability and is authorised and regulated by the Office of the Superintendent of Financial Institutions Canada. The Bank of Nova Scotia is authorized by the UK Prudential Regulation Authority and is subject to regulation by the UK Financial Conduct Authority and limited regulation by the UK Prudential Regulation Authority. Details about the extent of The Bank of Nova Scotia's regulation by the UK Prudential Regulation Authority are available from us on request. Scotiabank Europe plc is authorized by the UK Prudential Regulation Authority and regulated by the UK Financial Conduct Authority and the UK Prudential Regulation Authority.
Scotiabank Inverlat, S.A., Scotia Inverlat Casa de Bolsa, S.A. de C.V, Grupo Financiero Scotiabank Inverlat, and Scotia Inverlat Derivados, S.A. de C.V., are each authorized and regulated by the Mexican financial authorities.
Not all products and services are offered in all jurisdictions. Services described are available in jurisdictions where permitted by law.